From standard to graph to project
Singular Solving was working with a school that wanted to build its IT systems following HERM, the enterprise architecture standard used by universities, with the ambition that the result would evolve into a reference system for schools. Before weighing in on feasibility, I had to answer a much less glamorous question: what exactly is HERM and in what format does it exist.
The short answer is that it exists as a PDF poster and three Excel catalogs.
HERM is the Higher Education Reference Models, and it's no small project. It was born at CAUDIT in 2016 —the council of IT directors of Australasian universities— from a consultancy's work with eighteen universities, and version 3.0.0 (February 22, 2024) claims more than a thousand institutions using it. It's maintained by a working group that meets weekly, formally allied with the equivalent associations in the UK, Europe, and North America. It's published under CC BY-NC-SA 4.0, © CAUDIT. There are four models: business capabilities (BCM), a business model canvas, a conceptual data model (DRM), and the application map (ARM), the latter new in V3.
Those 420 codes are what you get from counting the identifiers in the three xlsx catalogs: 185 business capabilities (29 level-1 and 156 level-2), 18 topics and 76 data entities, and 3 domains + 22 capabilities + 116 application components. On that last figure it's worth being precise: 116 is what's in the v3.0.0 catalog; CAUDIT's official documentation cites 118. I preferred the figure I could count myself and documented the discrepancy instead of sweeping it away.
The finding that changes the brief
The important part showed up when reading the full catalogs, and it wasn't a number.
HERM defines taxonomies. It defines no buildable artifacts: no logical or physical data models, no executable processes, no APIs, no solution architectures. The internal seams between models are deliberately loose —the working group itself assessed the fine-grained matrix between capabilities and data and shelved it as “high effort, very subjective”—. And there is no machine-readable distribution: there's a PDF poster, an xlsx catalog, ArchiMate XML, and Visio. No JSON, no RDF, no API.
“Implementing HERM” is not an executable project; HERM can only be a project's guide, not its specification.
That sentence is what rearranges the brief. A descriptive framework published as a catalog is reference material: good for having conversations, not for making decisions about 116 pieces of software one by one. And the decision that had to be made was exactly that.
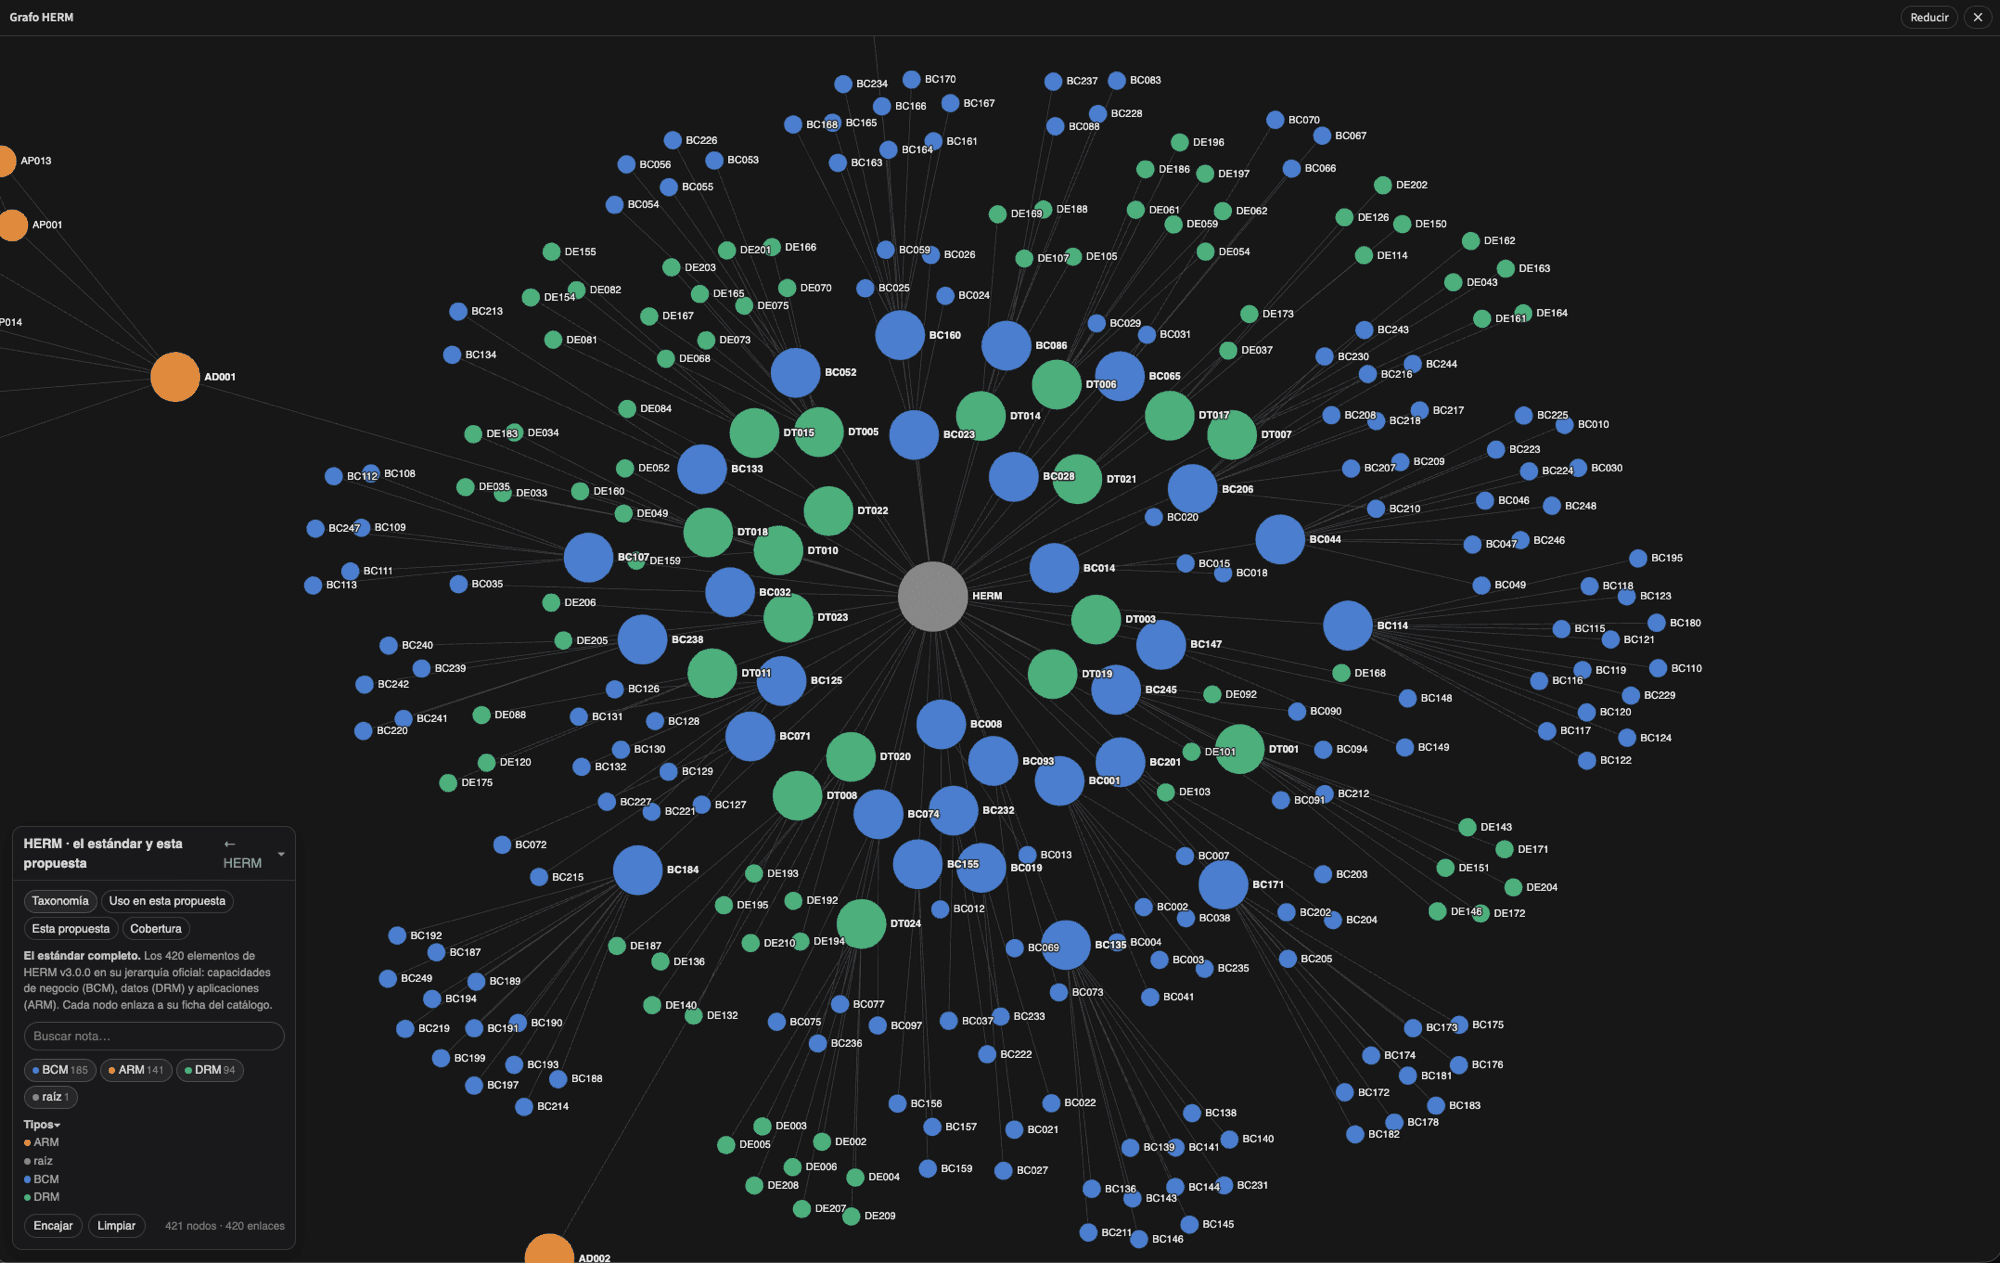
So I did the only thing that made the standard usable: turn it into a typed graph, with a real hierarchy, and paint the analysis of the educational platform proposal for Singular Solving on top. With that map in front of us, the real question could finally be answered: what to build, what to buy, and in what order.
OKF, or where the vocabulary lives
The engine is Quartz v5 plus an in-house toolkit, quartz-okf, which we released as open source. OKF is the Open Knowledge Format from Google Cloud (v0.1): a directory of markdown with YAML frontmatter. The toolkit adds a profile on top —a closed vocabulary of types and topology edges declared in the prose itself— plus the tool to validate it (okf-check), export a bundle with its machine-readable graph (okf-export) and compute documentation impact (okf-impact). Node ≥ 20, zero runtime dependencies.
The design decision that matters here: the engine knows nothing about the domain. The vocabulary lives in the repository that consumes it, in an okf.config.mjs. This project declared 16 types (the 14 from the reference profile plus proposal and organization) and 16 edge labels. The explorer draws whatever questions you declare as data; if the domain is different tomorrow, the overlay changes, not the engine.
The toolkit is pinned by commit SHA and never vendored. The repo has a file with a single line:
$ cat okf/quartz-okf.ref
92499340c04a0f7db434687d42b37d3286b76b78
The pipeline: three Python scripts
From xlsx to graph there are three steps, and each one solves a different problem. It's 395 lines of Python in total.
1. generate-herm-codes.py (109 lines). It parses the three xlsx files with openpyxl and emits herm-codes.json. The ugly part is that the sheets don't share a header: it has to be detected by sniffing the cells that contain code, id or end in id, and then resolve each column by partial name matching. The identifiers are extracted with a single regular expression, \b(BC|DT|DE|AD|AP|AC)\d{3}\b, and in the application map the prefix already gives the node's level: AD domain, AP capability, AC component.
This script runs once, locally, because the standard's corpus lives outside the repository: it arrived inside the client's document archive. The resulting JSON is committed and becomes the source of truth. The file declares its provenance in its first key:
{
  "source": "HERM V3.0.0 catalogues (22-feb-2024, © CAUDIT, CC BY-NC-SA 4.0)",
  "counts": { "BC": 185, "DT": 18, "DE": 76, "AD": 3, "AP": 22, "AC": 116 }
}
2. herm-linker.py (173 lines). Build step. It walks the notes and turns every mention of a code into a link to its catalog entry, with a "CODE · Official name" tooltip, and injects an anchor <span id="…"> at the first occurrence within the corresponding catalog. Writing a markdown linkifier is an exercise in knowing when not to touch the text: it doesn't enter frontmatter, code blocks, inline code, headings, or links that already exist, and on the BCM sheet it doesn't link BC codes to itself —though it does record them as mentions—.
The second function is what turns the linker into more than cosmetics: it parses the gap analysis. The analysis classified the ARM's 116 components with symbols in a markdown table column (🟢 core, 🔵 integrate, ⚪ evolution, ⬛ not applicable). The script reads that symbol as state, expands hand-written ranges code by code (ACxxx-ACyyy, comfortable to write and illegible to a naive parser) and also picks up the “block” classifications that appear in paragraphs outside tables. The editorial criterion —a table reviewable by hand— and the structured data that feeds the graph are the same file. There's no second copy to drift out of sync.
3. herm-to-okf.py (113 lines). It translates the dataset into the okf-graph/v1 schema the explorer consumes: the official hierarchy becomes Part of edges, mentions become Cita edges from the note that makes them, and the gap analysis state travels as the state node property, so that a mode can color and filter by it.
There are three decisions here that are written into the code, with their reasoning, because none of them is obvious:
- Synthetic root. A
HERMnode is added that doesn't exist in the standard: without it, the three models would float as islands with no visible relationship. - Aggregators get no state. The gap analysis classifies the pieces, not their containers. No property means no filter pill, so domains and capabilities stay always visible and their children never lose their link when filtering.
- The three catalogs are excluded from the mentions mode. They cite every code; including them would turn the mode into noise.
Making 420 nodes readable
A 420-node graph with hierarchy and cross-links comes out, by default, as a tangled mess. The layout parameters aren't decoration:
layout: {
  charge: -55,
  gravity: 0.045,
  link: {
    "*": { distance: 30, strength: 0.65 },
    Cita: { distance: 62, strength: 0.15 },
  },
}
A hierarchy reads well when the backbone is short and firm and the cross-links long and loose. And node size comes from its rank in the standard —root, aggregator, leaf—, not its number of children: a hierarchy is read by position.
The result is four declarative modes over the same canvas. Taxonomy: the full standard in its official hierarchy. Use in this proposal: the codes the analysis actually touches, with the notes that cite them around them. This proposal: the OKF topology of the repository itself, which is another graph and another corpus. And Coverage: the application map colored by the gap analysis, where the pills filter by state instead of by type.
The published graph has 427 nodes and 571 edges: 420 hierarchical and 151 citations.
Something unplanned came out of the journey: the viewer started as a repository-local HTML file and ended up as a reusable toolkit plugin, @zetesis/quartz-okf-explorer, which didn't exist when the project started. I kept the same URL on purpose, because the links injected into 85 pages were still valid. There was also a performance fix you can feel in the mouse: the canvas was making about 4,600 draw calls per frame.
Validating a knowledge site the way you validate an application
A static documentation site breaks in silence. It breaks when a wikilink stays literal because a table had an unescaped pipe, when the transpile cache serves the UI untranslated, when the anchor exists but the SPA router stomps the browser's jump. None of that throws an error.
So the repository carries its own E2E suite with Playwright, 139 lines, running against production and checking 19 pages:
$ okf/review.sh
OK — 19 páginas + grafo + anclas + auth verificados en producción
What it checks, in order of real usefulness: that without credentials the site returns 401; console errors and failed requests; that not a single English UI string appears (eleven are banned: min read, graph view, backlinks, blast radius…); that there are no [[ left unresolved; that no pending-text marker remains visible; that the #ac114 anchor in the ARM catalog actually scrolls; and that the graph canvas, in each of the four modes, has more than a thousand painted pixels. That last check is what distinguishes “the page loads” from “the graph renders”.
Deployment is Cloudflare Pages with Basic Auth in a Pages Function, and CI on GitHub Actions with Node 22: toolkit caching keyed by the pin file's hash, installation of Typst 0.14.2 —a school newsletter template is compiled to SVG on every build, as a documentation demo—, build, and wrangler pages deploy. d3 is served from the site itself, not from a CDN.
The site is private, behind Basic Auth. And that fits what the license says: HERM can be loaded as data into a platform and used as a design guide, but it can't be sold embedded. The report itself states in writing that, before packaging HERM as product data, it should be confirmed in writing with CAUDIT.
What of the standard is useful for a school
So far, the vehicle. The content riding inside is four documents, each with a different function.
Four deliverables, none of them decorative
What was delivered to Singular Solving. The school's system is not among them.
Standard analysis report
What HERM says, catalog by catalog, in the version that arrived in the corpus. It reproduces the full catalogs, not a summary of them.
Feasibility report
The verdict: three ways of doing the project compared against each other, with the facts and risks numbered.
Gap analysis of the application map
Every component of the application reference model, classified against the reality of a school.
Index of the received corpus
A topological index of the client's document archive: “if you're looking for X, go to Y”. It was the first useful deliverable, before any conclusions.
The school's system was not built. What was delivered is analysis, verdict, map, and proposal: the platform is a proposal, not a delivery.
What gets built and what gets bought is decided in the gap analysis, component by component. Its breakdown across the 116 components of the application map is exactly what the Coverage mode paints on the graph:
The most useful result was a subtraction. The research domain disappears wholesale —eighteen components in one block, a school doesn't manage doctoral applications— and with it the university specializations: degree accreditation, credit transfer, graduation ceremonies with ticket sales. A school's map is considerably shorter than the full catalog: a large part of the standard simply doesn't apply. Nearly half of the standard is surplus, and knowing that before signing anything changes the scope conversation.
And then there's the inverse gap, which is what truly made the exercise worthwhile. Walking the catalog with a Spanish school in mind surfaced everyday needs the standard doesn't name or covers only in passing —the cafeteria, the daily agenda between family and tutor— and they all pointed to the same place. It's not an oversight: the model was born in universities, where the student is an adult. The gap analysis nails it in one sentence —“the family as a first-class actor is the ARM's great absentee”— and that void is exactly the ground where building is justified over buying. The full inventory of those gaps is part of the delivered report.
Three paths, and a roadmap
With the map filtered, the feasibility report compared three ways of doing the project and kept one. The other two remain written down, because the reasoning behind discarding them is half of the argument.
The first was the literal reading of the brief: build the full suite the standard describes. It was discarded without nuance, and the argument is one of scale, not of willingness. Among those 116 components there are categories —student information system, financial ERP, HR management, timetable generation— where established products have decades and teams of hundreds of people behind them. In eight years, a community of more than a thousand institutions has not built that platform; its most advanced tool is an Excel and Power BI kit. The report closes it like this: “the literal version of the ambition is not feasible for anyone —not even for the sector's big players— and pursuing it would compromise the version that is”.
The second was to integrate market products and build nothing. It comes out viable as an operation and insufficient as a project: it solves the school's day to day, but leaves no replicable asset to Singular Solving. Even so, we didn't cross it out. It stayed written as a control counterfactual, the reference against which any in-house build has to justify itself. Deliberately uncomfortable.
The third is the recommended one, and it's the only one that answers both halves of the brief: advising on the system of one specific school and, at the same time, evaluating whether something replicable in other schools comes out of it. It consists of integrating market products for everything that's already solved and building only the differential parts —identity, data core, family relations, knowledge layer—, with the standard as a measuring reference and not as a specification.
The numbers support it from both sides. The gap analysis had already narrowed that fraction down to a short group of tractable components, not an entire map. And a case presented in the standard's European community classified 86% of one institution's capabilities as “System of Record”: coverable with market products or SaaS. Building on top of that 86% is remaking what already exists.
Build only where we add difference; integrate what's solved
From there comes the roadmap: seven phases, from 0 to 6. Each one closes with something in production and in use, each one is mapped against the standard, and none depends on the next one arriving. That last condition is what allows stopping at any point without being left halfway, and it's written as a viability condition, not as good intentions.
The foundational core
Phases 0 to 2, in the order set by the proposal. This is what's proposed, not what's done.
Discovery
A discovery questionnaire to surface the school's real capabilities. The gap analysis is declared a “preliminary, indicative classification prior to phase 0”: it organizes the terrain, it doesn't measure it.
Identity first
Keycloak, the school's realm, and the onboarding and offboarding of the school's people. It goes first because it's self-contained, depends on nothing, and supports everything that comes after.
Bringing families in
A family portal, authorizations with evidence, and corporate documents. This is the inverse-gap terrain: where the standard doesn't reach, you build.
For phases 3 to 6 the proposal leaves evolution, not detail: academic modules, the standard loaded as a living taxonomy, semantic search and assistant, multi-school consolidation. No phase has a start date.
The timelines are not set, and that's deliberate: “timelines will be estimated in the final version; what this proposal fixes is the order”. Nor is there a price figure to quote. The phase 1 offer lost its terms section before going out and remained a scope document, with a closing that asks to “validate this scope and set a start date”. Pricing work whose discovery hasn't been done yet is guessing.
What you gain by taking a framework apart
The graph is what made the analysis debatable. A nineteen-hundred-line report gets read once and filed away; a map where you can filter the 116 components by “we build this / we integrate this / this doesn't apply” and click each one through to its official definition gets used in a meeting, and can be rebutted piece by piece. There's the difference between delivering an opinion and delivering something to decide with.
The method doesn't depend on HERM. Any organization working against a normative framework published as a catalog —a security scheme, a sectoral capability model, a regulation with hundreds of controls— has the same problem: the document is inert and the decisions are per element. Turning it into a typed, auditable graph, with your own analysis painted on top, completely changes the conversation.
The Higher Education Reference Models (HERM) are © CAUDIT and are published under the CC BY-NC-SA 4.0 license. This post cites them with attribution and for analysis purposes; it does not reproduce their catalogs.
Frequently asked questions
What do I get at the end: a report or a tool?
Both. The analysis is delivered as a document readable from start to finish and as a navigable corpus, with every claim linked to its source. The latter is what's still useful six months later.
What if the conclusion is that I shouldn't do the project?
It gets written down. Here the report discarded the most ambitious version of the brief without nuance —we told Singular Solving in writing— and noted the “buy it ready-made” alternative as the reference against which to measure any in-house build.
Do I have to adopt the standard for this to be useful?
No. Here the standard was the object of analysis, not the destination. The method works with any corpus from which a per-element decision has to come out: regulations, internal documentation, a legacy application catalog.
Does the documentation stay with us?
Yes. They're markdown files with frontmatter, in an open format, and the publishing toolkit is open source and pinned by SHA. There's no product you depend on to read your own analysis.
More real-world cases

How to build your own knowledge graph with quartz-okf
Let the knowledge graph be built by the person who knows the domain

IT governance: who gets in, who can deploy, and how you prove it

Classifying documents into 77 categories without training a model
Setting up a homelab from scratch: backups and restore - Homelab (06/06)
Building a homelab from scratch: observability - Homelab (05/06)
Do you have a reference framework nobody uses because it lives in a PDF?
A security scheme, a sectoral capability model, a regulation with hundreds of controls: if the decisions are per element, the document isn't enough. Tell me which framework you work against and I'll tell you what I'd turn into a graph first.